Hi everyone,
I hope you’re having a good summer. After a bit of holiday, we’re back hard at work here at OpenCage HQ. Rather than rolling out any big new features though, we’ve set aside a few weeks to crank through the backlog of small fixes and features - nothing dramatic, but nevertheless the kinds of little tweaks that make a digital service simpler to use.
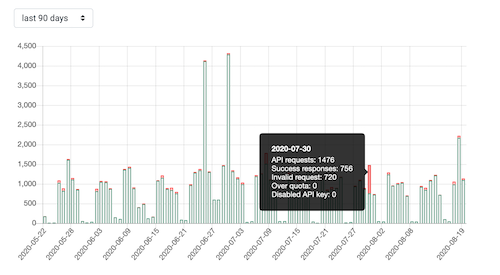
Today we rolled out exactly one such tweak. In your account dashboard we show you a bar chart of your API usage. Previously we has shown valid requests as green, and requests that generated an error as red. But we didn’t give you a way to see what the error might have been. This could be confusing because you might think the bad requests were due to being over the usage quota, when in reality there were due to badly formed queries.
Now, by hovering over the line, you can see a breakdown of the types of responses for a day (BTW in the API reference there is a full list of all possible API response codes).
It’s not the most dramatic feature, but hopefully it helps users of our API more quickly see what the problem is and thus find the path to a solution.
In the coming weeks I’ll do a few posts about improvements like these A big thanks to all of our customers and users who send us feedback and suggestions. It’s all too easy for us, as long time users of our service, to grow blind to little areas for improvement like this.
Please send us your ideas.
Happy geocoding,