Two weeks ago at #geomob, the London geo-innovation event we organise, we saw Andy Murdock present about his project OpenPopGrid, a great example of what is possible with the power of open data. I asked Andy if he’d be up for an interview here on our blog and he graciously agreed.
1. What is OpenPopGrid and who is behind the project?
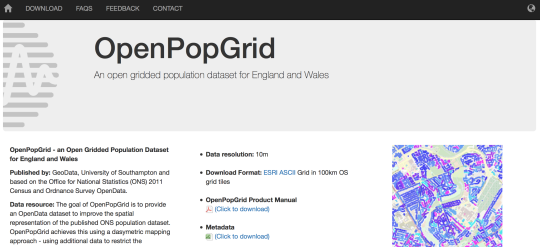
OpenPopGrid is a 10m resolution gridded population dataset for England and Wales which is based on the 2011 Census and Ordnance Survey OpenData. It was developed by a team from GeoData, where I am an associate and population specialists within Geography and Environment, University of Southampton.
2. Why have you started it, what are your goals with the project? What use cases do you see for the data?
The most geographically detailed dataset of population is the Office for National Statistics (ONS) 2011 Census postcode headcounts which provides population totals for individual postcodes. The problem is that multiple addresses share this postcode but individually these addresses may be some considerable distance from the point chosen to represent the postcode. This is equivalent to stacking the entire population of a street onto a single house. So when we use crisp buffers and zones within GIS to identify populations, the numbers we get are very sensitive to the locations of these points and gives an “all or nothing” result.
With OpenPopGrid we wanted to improve the spatial representation of where people live by re-distributing the population totals from the postcode point into the surrounding area. In doing so we also wanted to make sure that they were allocated to residential buildings only which we extracted from Ordnance Survey’s Vector Map District dataset and which we had allocated as residential and non-residential based on areas generated based on whether the postcode had population or not.
This provides a much better spatial representation of the population density of areas and which avoids unpopulated areas such as green spaces and most industrial areas.
The fact that population data has a wide variety of potential uses, we see many use cases for OpenPopGrid especially as it made available as an open dataset. Currently a number of academics are utilising the data in their research but we are also aware of or involved with commercial applications within environmental noise mapping, accessible greenspace modelling and access to public transportation.
3. What is the best way for people to get involved?
Probably the best way get involved is to download the data from openpopgrid.geodata.soton.ac.uk and start using it and to provide feedback on the dataset and any errors. We are really keen to hear how people are using the data and looking to showcase a number of use cases on the website.
4. How does OpenPopGrid compare with various commercial offerings?
Simply, OpenPopGrid is as good, if not better than commercial offerings, many of which simply reallocate population to an address point dataset and which suffers from the “same all or nothing” results from GIS overlay analysis. The obvious advantage with OpenPopGrid is that the improvement in geographical representation comes at no extra cost.
5. What are your hopes for OpenPopGrid going forward?
The main aim is get people using the data within their analysis and apps.
However, we wish to create a complete GB coverage and are currently seeking funding to prepare the data and run the model in Scotland. We also want to create some web services and enhance our user download facilities to allow user defined areas of interest to be extracted.
6. Right now OpenPopGrid is based on Ordnance Survey (the UK national mapping agency) OpenData. In your talk at #geomob you mentioned possible ways you hope to enhance the output using OpenStreetMap data. Can you go into a bit more detail?
Yes, this refers to our efforts to improve the allocation of buildings to residential and non-residential classes. Currently there is no non-commercial dataset available which provides this building classification. We know that our current method for generating residential postcode areas sometimes includes non-residential buildings, especially where settlements have residential and non-residential uses mixed together or in rural areas where the zones are much larger and may include agricultural buildings. We wish to explore further whether the OSM building classification could help us identify these non-residential buildings and to what extent. We also were keen to explore how we might be more pro-active about creating this dataset through crowd sourcing.
7. Our classic question: in 2014 OSM celebrated its 10th birthday, where do you think the project will be in 10 years time?
Having been aware of OSM for some considerable time, I have seen a gradual shift to much more positive attitudes towards the map. Still, there are many people who will not give up their commercial alternatives for OSM due to (perceived) quality and (perhaps legitimate) concerns over consistency of content. This is also perhaps not helped by Open Data offerings from familiar and “more trusted” sources like the Ordnance Survey. However, increasingly I see commercial organisations where OSM is routinely used as the standard basemap or hear people discussing OSM as a potential data source for features not shown on other maps or not currently available non-commercially (named pubs, supermarkets and other vernacular landmarks spring to mind from a recent project). In addition the ability to rapidly update the map or fill in missing features is a real strength which more users are also beginning to realise. This trend is likely to continue.
Where I think there could be a step change for the map is if more public bodies choose to maintain their own features of interest within the map. This would not only improve the content and updates but would also help allay perceived quality issues in some areas.
Referring back to the non-residential buildings for OpenPopGrid, having targeted actions at a set of features or attributes could also add considerable value to the map. While I might selfishly choose building classifications for starters, the community could further define features or attributes it wished to target to create more complete coverages.
So in 10 years time I would see even wider acceptance of OSM in commercial contexts and concerted actions in some areas to improve the consistency of detail and the features shown.
Thanks Andy, and congrats to everyone involved in the project. It is great to learn of a project where the open solution is superior to closed, proprietary offerings. Interestingly, the UK OSM community has been doing exactly the type of targeted action you describe - over the last few months schools has been the focus, with good success. I’m hopeful we’ll have an interview with someone involved in the effort in the near future and hopefully also a talk at a future #geomob. Meanwhile, anyone wanting to follow the progress of OpenPopGrid should follow @openpopgrid on twitter.
You can see all the Open Geo interviews here. If you are or know of someone we should interview, please get in touch, we’re always looking to promote people doing interesting things with open geo data.